Image Details
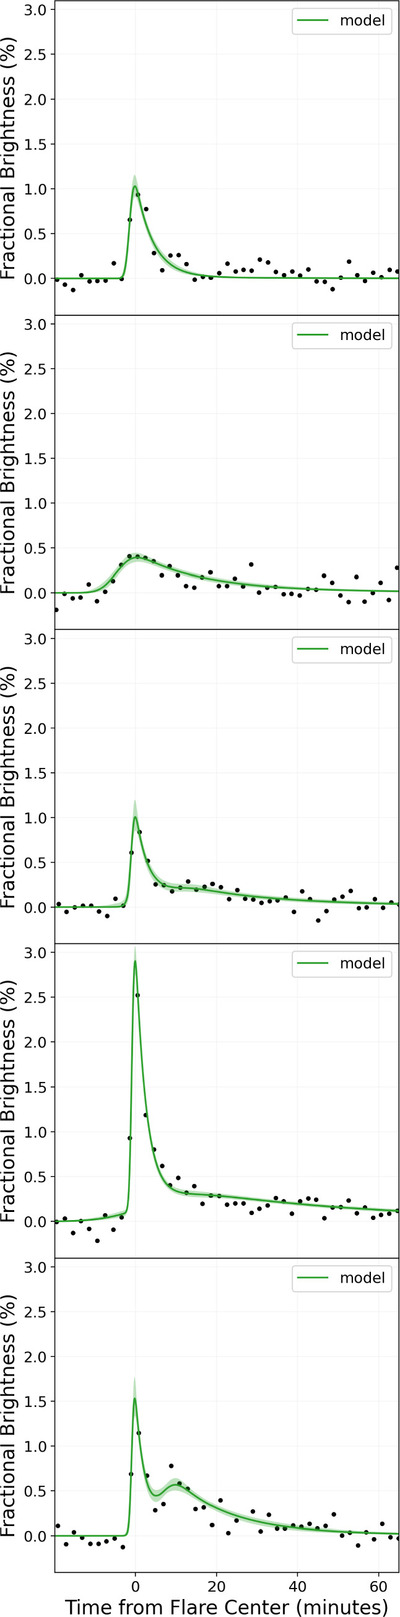
Caption: Figure 11.
Five flares of L 98-59 seen in TESS 2 minutes cadence data. The flares vary in peak fractional change in stellar brightness from 0.2% to 3.5%. There is also one complex flare that shows multiple peaks. The green curves are flare models with uncertainty regions inferred using an MCMC method.
Other Images in This Article

Show More
Copyright and Terms & Conditions
© 2025. The Author(s). Published by the American Astronomical Society.
Copyright ©
2025 Astronomy Image Explorer. All Rights Reserved.