Image Details
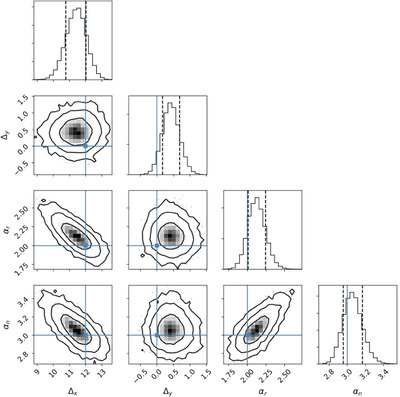
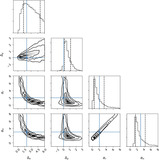
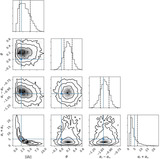
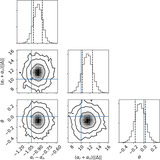
Caption: Figure 7.
The likelihood function ﹩P({\widehat{D}}_{T}| {{\rm{\Delta }}}_{x},{{\rm{\Delta }}}_{y},{\alpha }_{r},{\alpha }_{n})﹩ evaluated for simulation 7 using the (true) point-source center location x c = ( p + q )/2 as a function of model parameters Δ x , Δ y , α r , and α n (see Section 3.4). The evaluation was performed using MCMC sampling. The figure shows the marginal distributions over single parameters (upper diagonal) as well as the marginal distributions for all parameter pairs (off-diagonal). The blue point indicates the true model parameters while the curves indicate the 68%, 95%, and 99.7% confidence regions. The dashed vertical lines indicate the 1σ confidence intervals in the one-dimensional marginals.
Other Images in This Article
Show More
Copyright and Terms & Conditions
© 2024. The Author(s). Published by the American Astronomical Society.