Image Details
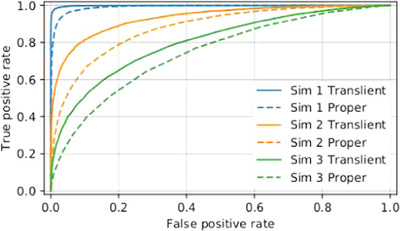
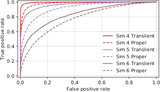
Caption: Figure 5.
Receiver operating characteristic (ROC) curves for simulations 1–3 (varying levels of flux noise) showing the rates of true-positive events as a function of the false-positive event rate. These curves were generated by varying detector threshold levels η over an appropriately wide range. Each color represents a simulation index (noise level) while solid (dashed) curves represent the resulting performance when using the translient statistic (proper statistic). One can see that for all simulations and at all values of the false-positive rate the translient statistic achieves a higher true-positive detection rate compared to the proper statistic. We also see that lower levels of noise allow the detectors to reach higher true-positive rates at set false-positive rates.
Other Images in This Article
Show More
Copyright and Terms & Conditions
© 2024. The Author(s). Published by the American Astronomical Society.