Image Details
Caption: Figure 3.
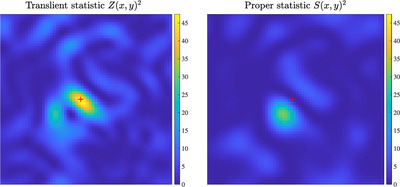
Resulting translient statistic (Z 2; left panel) and proper statistic (S 2; right panel) images computed for the image pair shown in Figure 2. The red crosses mark the location of x c ≡ ( p + q )/2, the center between the positions of the point sources in the reference and new images. In the squared translient statistic image one can see a single peak approximately centered at x c , whereas in the squared proper statistic image two peaks on opposite sides of x c (diagonally) can be observed. This is the typical qualitative appearance of the two detector images when the data are generated by a point source undergoing pure translation (without any flux change). S 2 has units of ﹩{\left({\rm{S}}/{\rm{N}}\right)}^{2}﹩, and since σ n = σ r , then the S/N in the N and R images is about ﹩\sqrt{2}﹩ times higher compared to the value in the S image.
Other Images in This Article
Show More
Copyright and Terms & Conditions
© 2024. The Author(s). Published by the American Astronomical Society.