Image Details
Caption: Figure 18.
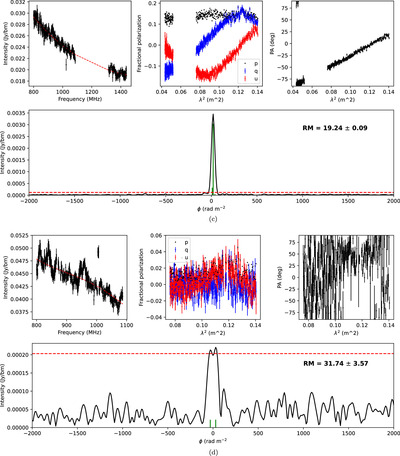
Example Stokes Iqu spectra, polarization angles, and Faraday spectra for a variety of components from our four observations. (a) Median-filtered EL Faraday simple component J221024-505540. Top left: Stokes I spectrum (black) and model fit from 1D RM synthesis with RM-Tools (red dashed). Top center: Stokes q (blue), u (red), and polarized fraction (black) spectra. Top right: polarization angle ﹩\psi ﹩ as a function of ﹩{\lambda }^{2}﹩. Bottom: clean Faraday spectrum (black) with clean peaks (green) and 8﹩\sigma ﹩ GES clean threshold (red dashed). (b) As for 18(a), but in the EM, convolved to the resolution of EL and EC (21 arcsec). (c) As for 18(a), but for the EC data. (d) Unfiltered GL observation component J154230-545826. Plots are as described in Figure 18(a). This is an example of where foreground diffuse emission is brighter in polarized intensity than a faint background component. We confirm that this is in fact a situation of diffuse emission dominating the background component by visual inspection of the diffuse and component maps from the median filter process. The clean peak at ﹩\phi ﹩ = +31.7 rad m−2 is due to foreground diffuse emission, while the clean peak at clean peak at ﹩\phi ﹩ = −32.3 rad m−2 is the background component RM. The clean peak associated with the diffuse emission is brighter in polarized intensity than the peak associated with the background component, so 1D RM synthesis returns the diffuse emission ﹩\phi ﹩ as the component RM. (e) As for 18(d), but after median filtering. The application of the median filter reduces the intensity of the diffuse emission peak at ﹩\phi ﹩ = +31.7 rad m−2 to below the 8﹩\sigma ﹩ GES clean threshold, leaving the component clean peak at ﹩\phi ﹩ = −32.3 rad m−2 as the brightest detectable peak, as desired. (f) Unfiltered EL Faraday complex component J220307-494052. Plots are as described in Figure 18(a). The dominant clean peak is at ﹩\phi ﹩ = 9.7 ﹩\pm ﹩ 1.0 rad m−2. (g) As for 18(f) but after median filtering. We see the expected reduction in polarized intensity due to the application of the median filter in the Stokes ﹩qu﹩ spectra and Faraday spectrum as compared with 18(f). The dominant clean peak is at ﹩\phi ﹩ = 9.4 ﹩\pm ﹩ 0.9 rad m−2, which is consistent with 18(f).﹩\psi ﹩
Other Images in This Article
Show More
Copyright and Terms & Conditions
© 2024. The Author(s). Published by the American Astronomical Society.