Image Details
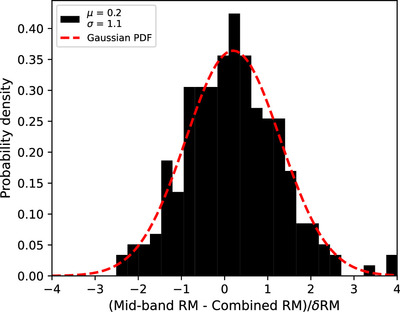
Caption: Figure 11.
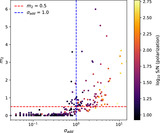
Distribution of the difference between the EM and EC RMs in units of δRM. We overplot a Gaussian fit to the data, shown by the dashed red line. There are three points beyond ±3σ and no points beyond the bounds of the graph. The distribution has μ ∼ 0 and σ ∼ 1, suggesting that the large spread in RMs in Figure 10 is due to the large RM uncertainties in the EM and is not an issue with data quality.
Other Images in This Article

Show More
Copyright and Terms & Conditions
© 2024. The Author(s). Published by the American Astronomical Society.
Copyright ©
2025 Astronomy Image Explorer. All Rights Reserved.