Image Details
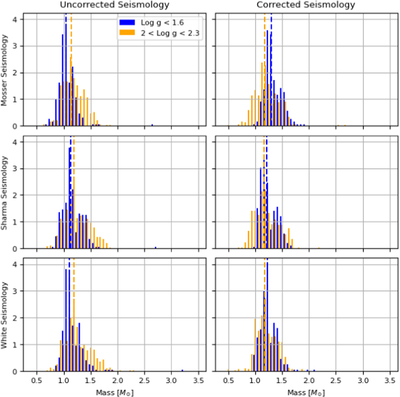
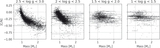
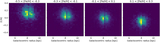
Caption: Figure 14.
Histograms showing the distribution of masses predicted by the six models. The left column shows uncorrected masses, and the right column shows the corrected masses. The histograms are split into a low log g bin (blue) and high log g bin (orange).
Other Images in This Article
Show More
Copyright and Terms & Conditions
© 2024. The Author(s). Published by the American Astronomical Society.
Copyright ©
2025 Astronomy Image Explorer. All Rights Reserved.