Image Details
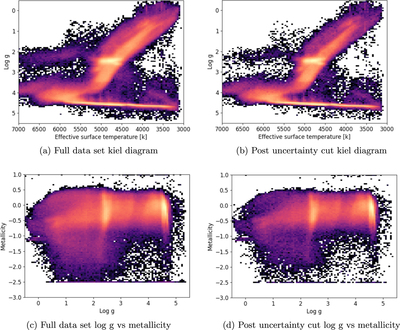
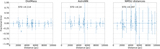
Caption: Figure 1.
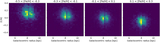
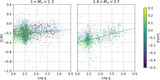
Density plots showing the Kiel and metallicity diagrams and for the full data set ((a) and (c)) and for the training set after the 15% distance uncertainty cutoff ((b) and (d)). Color scale is logarithmic.
Other Images in This Article
Show More
Copyright and Terms & Conditions
© 2024. The Author(s). Published by the American Astronomical Society.
Copyright ©
2025 Astronomy Image Explorer. All Rights Reserved.