Image Details
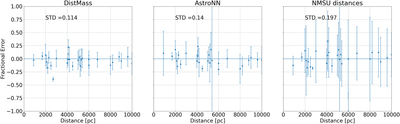
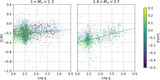
Caption: Figure 5.
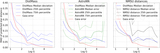
Model fractional error vs. cluster distance for cluster stars. Blue points show the average predicted distance to each cluster. The error bars show the standard deviation of the scatter in distance predictions for stars in each cluster around the mean distance. Scatter of the cluster distance averages is printed for each distance method. Panel (a) shows our model results, panel (b) shows AstroNN (Leung & Bovy 2019), and panel (c) shows NMSU distances. STD of the cluster distance average (orange points) is printed for each plot.
Other Images in This Article
Show More
Copyright and Terms & Conditions
© 2024. The Author(s). Published by the American Astronomical Society.
Copyright ©
2025 Astronomy Image Explorer. All Rights Reserved.