Image Details
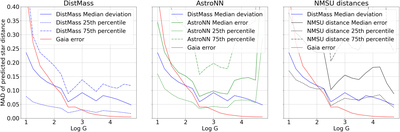
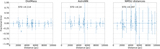
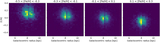
Caption: Figure 4.
Blue line in all plots shows the MAD of test stars vs. surface gravity for our model. Red shows the Gaia parallax uncertainty. Figure (a) shows just our model compared to the Gaia error, with the dashed lines showing the quartile of the absolute deviation. Figure (b) shows AstroNN’s (Leung & Bovy 2019) MAD and quartile ranges in green compared to Gaia and our model. Figure (c) shows the Bayesian NMSU distance MAD in black. The deviations reported here are the listed stellar distance from each method compared against the Gaia distances.
Other Images in This Article
Show More
Copyright and Terms & Conditions
© 2024. The Author(s). Published by the American Astronomical Society.
Copyright ©
2025 Astronomy Image Explorer. All Rights Reserved.