Image Details
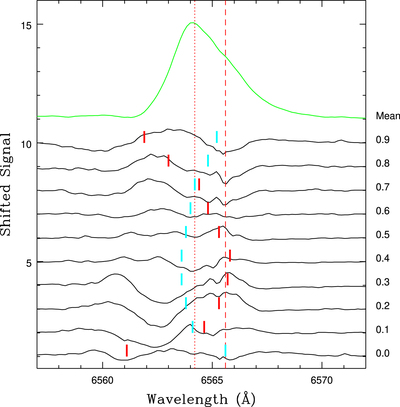
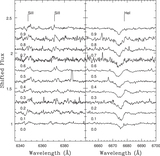
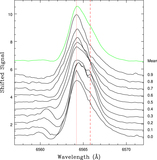
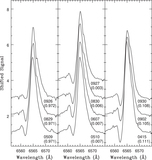
Caption: Figure 9.
Residual spectra that are the result of subtracting the mean Hα profile (shown in green) from the phase-binned spectra in Figure 8. The vertical dotted and dashed red lines mark the same features as in Figure 8. The red hash marks above each curve indicate the expected location of Hα at that phase if it followed the radial-velocity curve of the brighter star. The corresponding cyan hash marks indicate the expected location of Hα based on the radial velocities of the companion, as inferred from the solid line in the middle panel of Figure 7. The peak in the residuals propagates in a manner that is consistent with the motion of the brighter star, as expected if the bulk of the emission is associated with that star.
Other Images in This Article
Copyright and Terms & Conditions
© 2023. The Author(s). Published by the American Astronomical Society.