Image Details
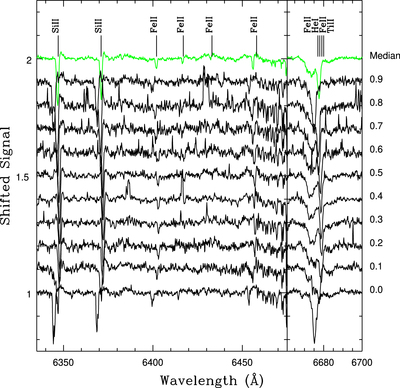
Caption: Figure 2.
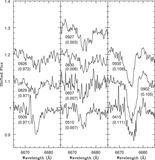
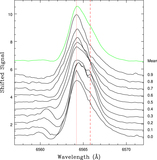
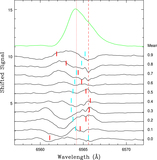
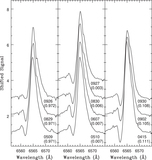
Phase-binned spectra of V1507 Cyg in two wavelength intervals. The centroids of the phase bins are listed along the right axis. The spectrum plotted in green is the median of the binned spectra after shifting them into the rest frame. The shapes of the Si II and He I lines change with orbital phase in a similar manner. The centers of the Si II, Fe II, and He I lines have a skewed appearance near phase 0.0, and in the text this behavior is attributed to tidal effects during periastron. The depression in the spectrum at wavelengths shortward of He I does not track the He I line in the spectrum of the brighter star, and in Section 4 it is argued that this trough is part of a P Cygni profile that originates in an envelope around the heavily obscured companion.
Other Images in This Article
Copyright and Terms & Conditions
© 2023. The Author(s). Published by the American Astronomical Society.