Image Details
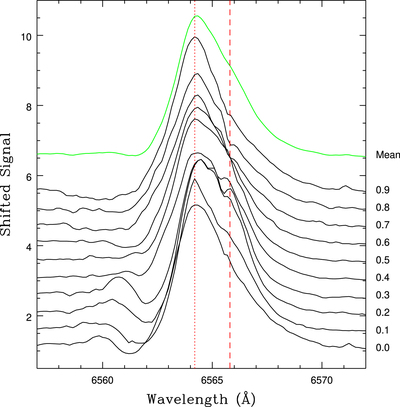
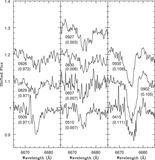
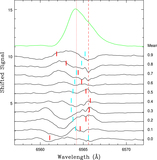
Caption: Figure 8.
Hα profiles in phase-binned spectra. The contribution from the brighter star, which is assumed to have Hα based on the template β Ori spectrum, has been removed. The mean of the profiles is shown in green. The overall morphology of the Hα profile at some phases is similar to what is seen in the spectrum of some Herbig AeBe stars (e.g., Hamann & Persson 1992). The vertical red lines mark the approximate locations of the peak in Hα emission (dotted line) and a second bump that is slightly redward of the main peak that is most clearly seen between phases 0.2 and 0.5 (dashed line). The absorption trough between 6559 and 6560 Å that is present between phases 0.0 and 0.4 is likely due to blueshifted Hα absorption.
Other Images in This Article
Copyright and Terms & Conditions
© 2023. The Author(s). Published by the American Astronomical Society.