Image Details
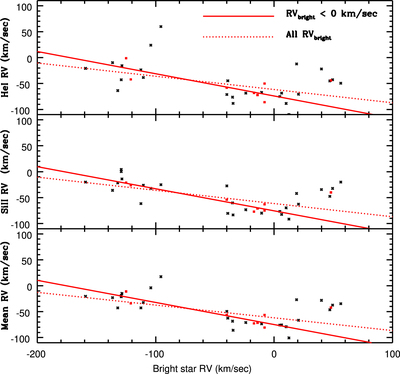
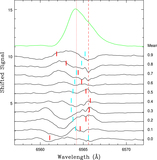
Caption: Figure 7.
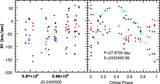
Radial-velocity measurements of the bright star are compared with velocities measured from the He I profile (upper panel) and Si II emission (middle panel) in the envelope spectra. The mean of the combined He I and Si II emission velocities is shown in the bottom panel. The filled red squares are the mean velocities in phase intervals that are 0.1 unit wide where at least two velocity measurements were made. The dashed red lines show a least-squares fit to all of the phase-binned velocities, while the solid red lines show a least-squares fit that does not include the outlying point in the binned measurements that has v brightstar > 0 km s−1. That the velocities measured from the He I profile and the Si II emission lines are anticorrelated with the velocities measured for the bright star over much of the orbital velocity range of the bright star is consistent with them tracking the orbital motion of the companion.
Other Images in This Article
Copyright and Terms & Conditions
© 2023. The Author(s). Published by the American Astronomical Society.