Image Details
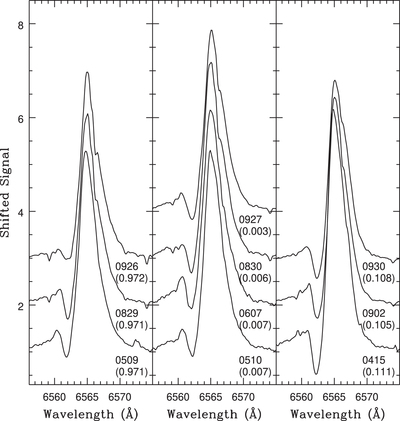
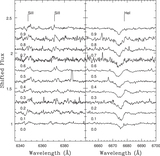
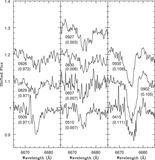
Caption: Figure 10.
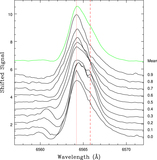
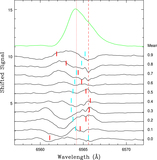
Same as Figure 5, but showing Hα. The overall shape of Hα emission varies with time in each phase interval in a more-or-less consistent manner, in the sense that the red bump appears in spectra recorded after 2022 June. The depth of the trough to the left of the main emission feature weakens with the appearance of the red bump, suggesting that they might be related. The relative height of Hα emission is roughly constant with time in the left-hand panel, and changes only slightly with time in the middle panel. However, significant changes in the height of Hα occur with time in the right-hand panel, in the sense that the peak height of the emission weakens with time. This is accompanied by a decrease in depth of the blue absorption trough.
Other Images in This Article
Copyright and Terms & Conditions
© 2023. The Author(s). Published by the American Astronomical Society.