Image Details
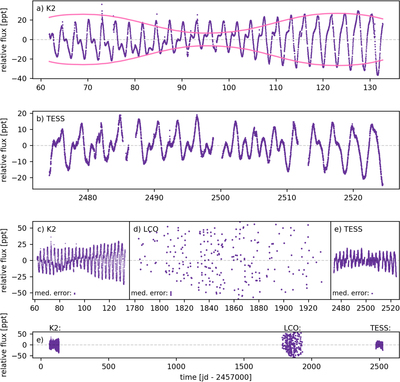
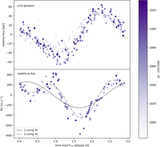
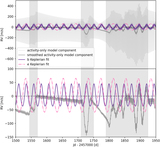
Caption: Figure 9.
A tour of the relevant photometry of the star V1298 Tau. Panel (a): detailed view of the K2 photometry (purple points), with a beating envelope overplotted in solid pink. The beating envelope is drawn to illustrate the effect of spot beating on the overall variability amplitude, not to fit the data precisely. The envelope drawn is constructed from the beating of three sinusoids at 2.70, 2.85, and 3.00 days. Signatures of beating can be seen by eye: two peaks of different amplitudes phase up toward the end of the K2 baseline, producing a single-peaked variability pattern and a larger overall variability amplitude. Panel (b): detailed view of the TESS photometry (purple points). Beating characteristics are also visible, although the baseline is shorter than that of K2. Panels (c), (d), and (e): relative views of K2, LCO, and TESS photometry, emphasizing the relative temporal baselines and variability amplitudes. A typical error bar for each data set is also shown in the bottom left corner of each panel. The differences in wavelength coverage and flux dilution between the K2, LCO, and TESS photometry largely account for the overall differences in amplitude of the signals. Both the K2 and TESS data cover less than one complete beat period of the two largest-amplitude periodic signals, but the LCO photometry (which is contemporaneous with the RVs of SM21) covers a longer temporal baseline. Panel (e): all photometry, plotted on the same panel to emphasize the relative time elapsed between each data set. Takeaway: differential rotation effects are visible by eye in both the K2 and TESS data sets.
Other Images in This Article
Show More
Copyright and Terms & Conditions
© 2023. The Author(s). Published by the American Astronomical Society.