Image Details
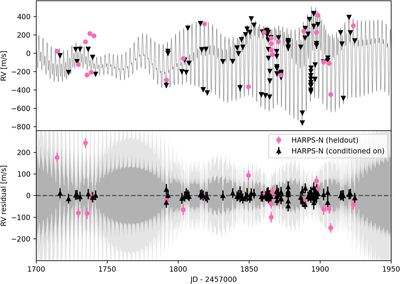
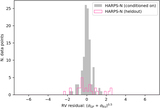
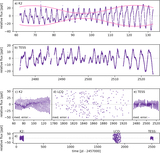
Caption: Figure 4.
Same as Figure 2, except that the model prediction is computed by conditioning on a randomly selected 80% subset of the HARPS-N data, as described in the text; the residuals are computed for the 20% subset that was held out. Takeaway: the effect seen in Figure 2 cannot be explained by instrument- or wavelength-dependent systematics, because the same larger residuals are seen within the data taken by only HARPS-N.
Other Images in This Article
Show More
Copyright and Terms & Conditions
© 2023. The Author(s). Published by the American Astronomical Society.
Copyright ©
2026 Astronomy Image Explorer. All Rights Reserved.