Image Details
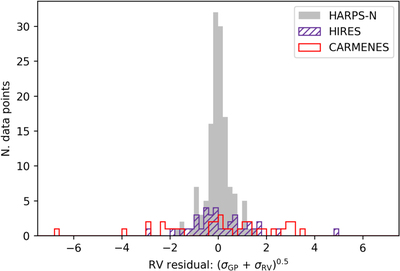
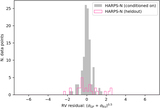
Caption: Figure 3.
Another visualization of Figure 2. Histograms of the RV residuals, given in units of standard deviation from the mean prediction. Takeaway: the broader and more uniform distributions of HIRES and CARMENES residuals relative to the HARPS residuals is another hallmark of overfitting.
Other Images in This Article
Show More
Copyright and Terms & Conditions
© 2023. The Author(s). Published by the American Astronomical Society.
Copyright ©
2026 Astronomy Image Explorer. All Rights Reserved.