Image Details
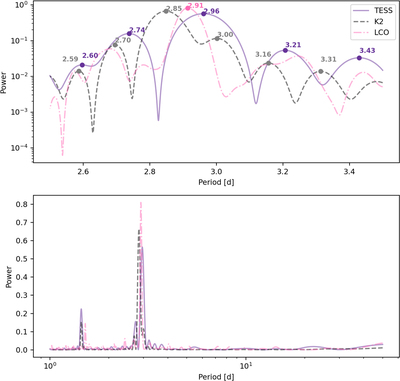
Caption: Figure 10.
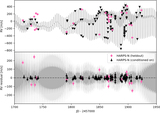
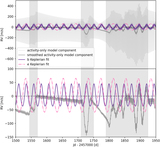
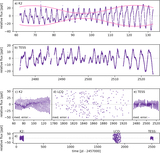
Lomb–Scargle periodograms of the photometric data shown in Figure 9. Top: zoom in on the presumed rotation period, showing several nearby peaks in all three data sets. Bottom: same as the top over a wider period range. Takeaway: multiple closely related periodicities are visible in Fourier space for all three photometric data sets, providing more evidence for differentially rotating active regions.
Other Images in This Article
Show More
Copyright and Terms & Conditions
© 2023. The Author(s). Published by the American Astronomical Society.
Copyright ©
2026 Astronomy Image Explorer. All Rights Reserved.