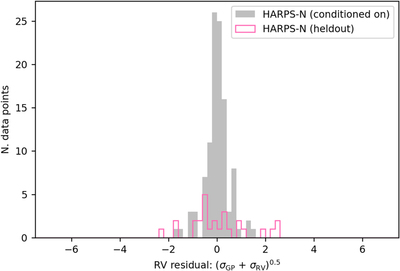
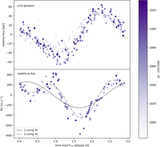
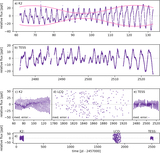
Another visualization of Figure 4. Same as Figure 3, except computed using the same method as for Figure 4. Takeaway: the larger and more uniform spread of residuals for the HARPS-N data on which the model was conditioned provides more evidence that the preferred SM21 model is overfitting.