Image Details
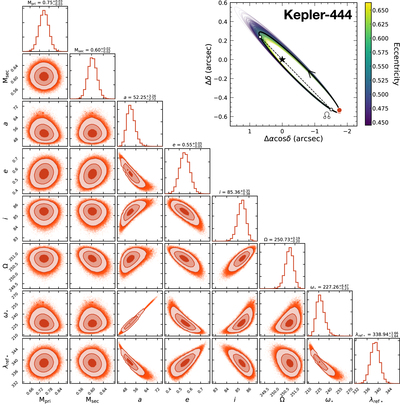
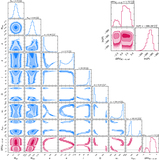
Caption: Figure 4.
Posteriors from our orbit analysis of Kepler-444. Details about each parameter, including credible intervals and the best-fit values of these parameters, are listed in Table 4. The top right panel shows the predicted relative astrometry between the A and BC components based on 1000 randomly drawn orbits from the MCMC chains, here color-coded by eccentricity. The black solid line shows the best-fit orbit. The two white circles mark the ascending node (i.e., the point in BC’s orbit in which it is moving toward the observer through the sky plane; labeled) and the descending node connected via a dashed line (i.e., the line of nodes). Kepler-444 A is shown as a black star, and the observed relative astrometry of BC traces out the orbital arc at the bottom right.
Other Images in This Article
Copyright and Terms & Conditions
© 2023. The Author(s). Published by the American Astronomical Society.