Image Details
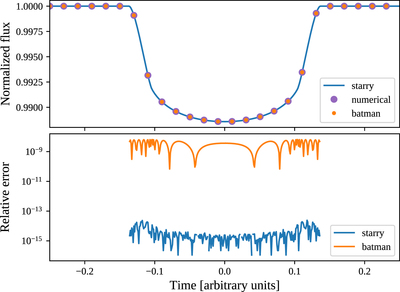
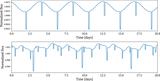
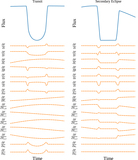
Caption: Figure 8.
Sample transit light curve for a planet (r = 0.1) transiting a quadratically limb-darkened star (u1 = 0.4, u2 = 0.26). The top panel shows the starry (blue curve) and batman (orange dots) light curves, as well as a light curve generated by a high-precision direct numerical integration of the surface integral (purple dots). The bottom panel shows the relative error on the flux compared to the high-precision numerical solution for starry (blue) and batman (orange; Python).
Other Images in This Article

Show More
Copyright and Terms & Conditions
© 2019. The American Astronomical Society. All rights reserved.
Copyright ©
2025 Astronomy Image Explorer. All Rights Reserved.