Image Details
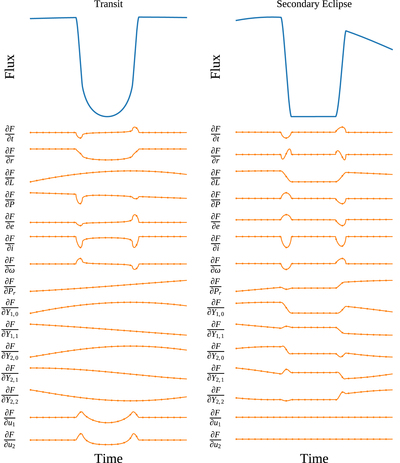
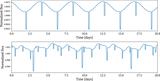
Caption: Figure 10.
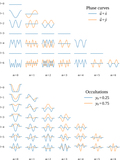
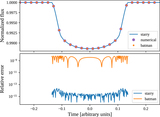
Transit (top left) and secondary eclipse (top right) of a mildly eccentric, slightly inclined, quickly rotating hot Jupiter with a dipole map, computed with starry. Derivatives as a function of time for several of these parameters are plotted in orange below each light curve. Solid lines correspond to the analytic derivatives, and dots correspond to derivatives evaluated numerically using finite differences. From top to bottom, the curves correspond to derivatives with respect to time, planet radius, planet luminosity, orbital period, eccentricity, inclination, longitude of pericenter, rotational period, five of the planet surface map coefficients, and the linear and quadratic stellar limb-darkening coefficients (Python).
Other Images in This Article

Show More
Copyright and Terms & Conditions
© 2019. The American Astronomical Society. All rights reserved.