Image Details
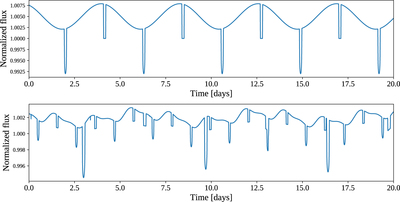
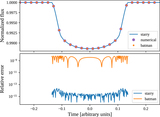
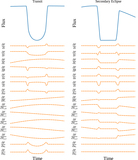
Caption: Figure 9.
Sample analytic exoplanet system light curves computed with starry. Top: a hot Jupiter transiting a Sun-like star. The planet’s map is a simple dipole, with the hotspot offset ﹩15^\circ ﹩ from stellar noon; the offset in the secondary eclipse from the peak of the phase curve is apparent. Bottom: a two-planet system with more complex surface maps. In addition to transits and secondary eclipses, a few planet–planet occultations are visible (e.g., the very short events at t = 0.1 and t = 3.4 days; Python).
Other Images in This Article

Show More
Copyright and Terms & Conditions
© 2019. The American Astronomical Society. All rights reserved.
Copyright ©
2025 Astronomy Image Explorer. All Rights Reserved.