Image Details
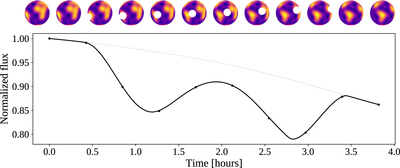
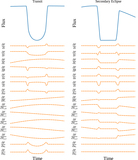
Caption: Figure 7.
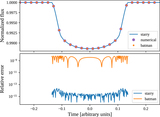
Occultation light curve for the Moon transiting the rotating Earth, computed from the lmax = 10 expansion from Figure 4. The two largest dips are due to the occultations of South America (left) and Africa (right). Once again, the black dots correspond to the numerical solution (see Section 4.7). For reference, the light gray dots correspond to the rotational light curve in the absence of the occultor (Python).
Other Images in This Article

Show More
Copyright and Terms & Conditions
© 2019. The American Astronomical Society. All rights reserved.
Copyright ©
2025 Astronomy Image Explorer. All Rights Reserved.