Image Details
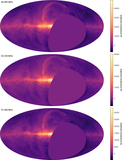
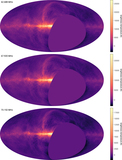
Caption: Figure 8.
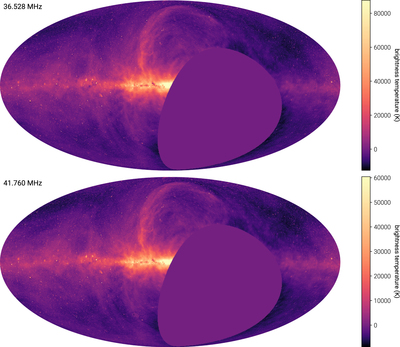
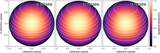
These eight panels illustrate (with a Mollweide projection and logarithmic color scale) the eight full-sky maps generated with Tikhonov-regularized m-mode analysis imaging and the OVRO-LWA. Each map covers the sky north of δ = −30° with angular resolution of ∼15′. Eight bright sources have been removed from each map (Cyg A, Cas A, Vir A, Tau A, Her A, Hya A, 3C 123, and 3C 353). The small blank region near l = +45.°7, b = −47.°9 corresponds to the location of the Sun during the observation period. A detailed summary of the properties of each map is given in Table 1.
Other Images in This Article
Show More
Copyright and Terms & Conditions
© 2018. The American Astronomical Society. All rights reserved.
Copyright ©
2026 Astronomy Image Explorer. All Rights Reserved.