Image Details
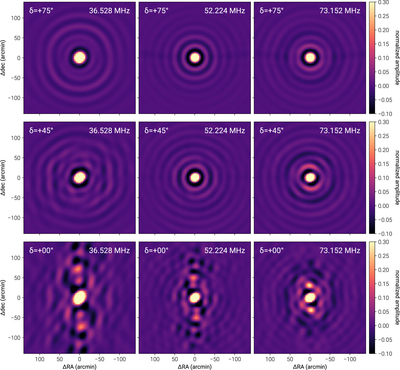
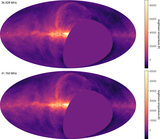
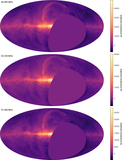
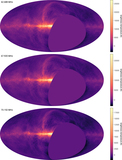
Caption: Figure 3.
The m-mode analysis imaging PSF at three decl. (top row: δ = +75°, middle row: δ = +45°, bottom row: δ = +0°) and three frequencies (left column: 36.528 MHz, middle column: 52.224 MHz, right column: 73.152 MHz). The PSF is computed by evaluating Equation (16). Above 55 MHz, the angular extent of the PSF does not follow the expected scaling with frequency because the angular resolution is limited by the selection of lmax = 1000. The FWHM at δ = +45° is listed in Table 1.
Other Images in This Article
Show More
Copyright and Terms & Conditions
© 2018. The American Astronomical Society. All rights reserved.
Copyright ©
2026 Astronomy Image Explorer. All Rights Reserved.