Image Details
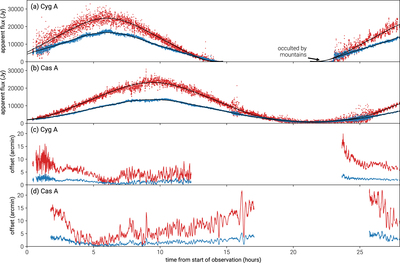
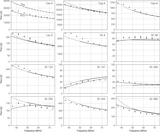
Caption: Figure 5.
Panels (a) and (b) show the measured apparent flux of Cyg A and Cas A at 36.528 MHz (red points) and 73.152 MHz (blue points) as a function of time over the observing period. The solid black curves show the expected flux computed using the empirical beam model fits. The thermal noise contribution to each point is about 50 Jy. Cyg A is occulted by the White Mountains when it is low on the horizon to the east. Panels (c) and (d) show the measured position offset of Cyg A and Cas A relative to their true astronomical positions at 36.528 MHz (red line) and 73.152 MHz (blue line).
Other Images in This Article
Show More
Copyright and Terms & Conditions
© 2018. The American Astronomical Society. All rights reserved.
Copyright ©
2026 Astronomy Image Explorer. All Rights Reserved.