Image Details
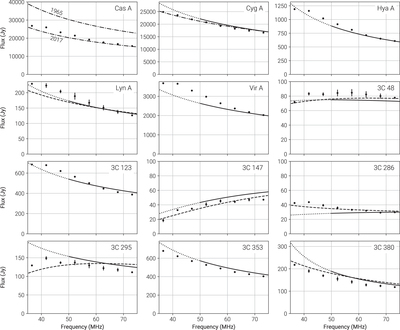
Caption: Figure 7.
Measured fluxes (black points) of 11 sources plotted against the published spectra from (PB17; solid line above 50 MHz, dotted line below 50 MHz), (SH12; dashed line), and Baars et al. (1977) (dot-dashed line). Cas A is compared against a spectrum assuming a secular decrease of 0.77% yr–1 (Helmboldt & Kassim 2009).
Other Images in This Article
Show More
Copyright and Terms & Conditions
© 2018. The American Astronomical Society. All rights reserved.
Copyright ©
2026 Astronomy Image Explorer. All Rights Reserved.