Image Details
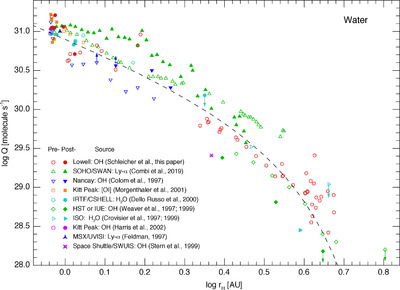
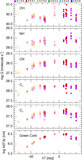
Caption: Figure 6.
Logarithm of water production rates plotted as a function of log heliocentric distance as determined by a variety of different types of measurements. Preperihelion data are shown as open symbols, and postperihelion are filled. Our data, derived from the OH measurements reported in this paper, are presented as circles, while other data sets are given in the key, including the method of observation (see Section 3.5 for details regarding each data set). The dashed curve represents the prediction of a simple sublimation model scaled to these data at intermediate distances, using an active area of 2200 km2 (see text for details). While the overall behavior of water production is well matched by the sublimation model, there is a clear asymmetry between inbound and outbound data beyond about 2.3 au that largely reverses inside of 2 au. An excess above this baseline of activity is also evident in the few months surrounding perihelion; these deviations from the simple curve are largely explained by the seasonal effects associated with our preliminary modeling of the major source regions (see Section 3.6).
Other Images in This Article

Copyright and Terms & Conditions
© 2024. The Author(s). Published by the American Astronomical Society.