Image Details
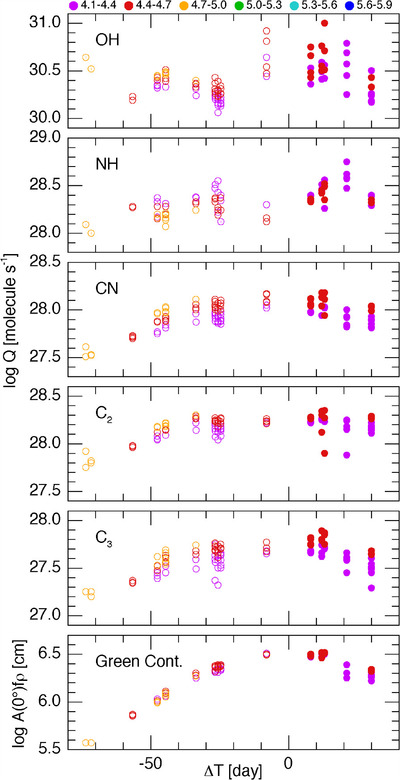
Caption: Figure 5.
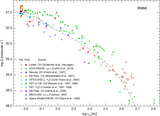
Detail from Figure 2 for the perihelion time frame for early 1997. Again, the logarithm of the production rates for the observed molecular species and A(0°)fρ for the dust as a function of time from perihelion. Aperture trends (see color key) are quite evident, as well as significant rotational variability for gas species, but are nearly nonexistent for the dust.
Other Images in This Article

Copyright and Terms & Conditions
© 2024. The Author(s). Published by the American Astronomical Society.
Copyright ©
2025 Astronomy Image Explorer. All Rights Reserved.