Image Details
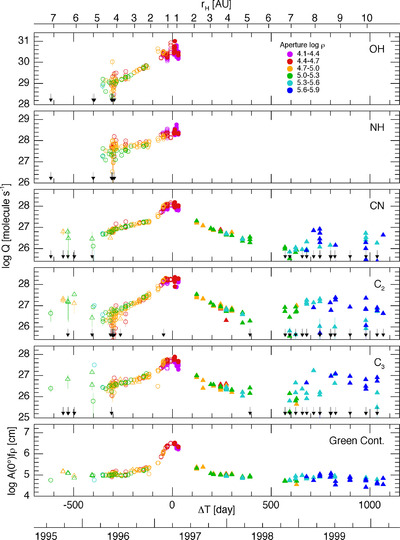
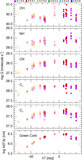
Caption: Figure 2.
Logarithm of the production rates for the observed molecular species and A(0°)fρ for the dust as a function of time from perihelion (1997 April 1). Observations obtained from Lowell Observatory are shown as circles, while those from Perth Observatory are given as triangles; neither OH nor NH were observed from Perth. Inbound data are plotted with open symbols and outbound as filled. Color-coding is based on aperture size, using the logarithm of the projected radius in kilometers within bins shown at the top of the figure. The large scatter among data taken beyond about 6 au is generally due to the small fraction of the signal that remains following continuum subtraction, often resulting in negative gas values. Negative results are shown as downward arrows near the bottom of each panel and are also listed as “undefined” in Table 3.
Other Images in This Article
Copyright and Terms & Conditions
© 2024. The Author(s). Published by the American Astronomical Society.