Image Details
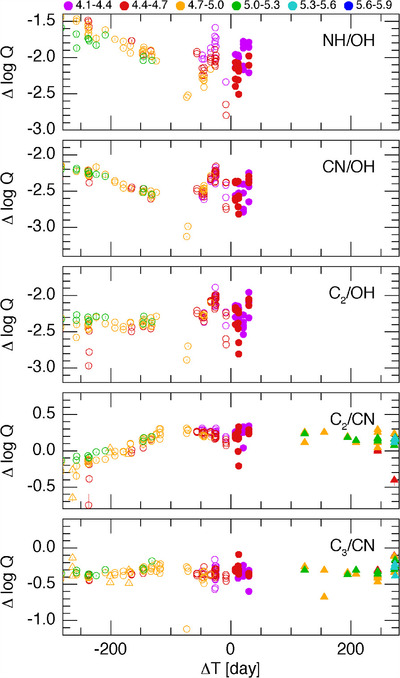
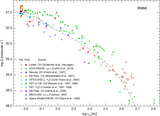
Caption: Figure 4.
Logarithm of production rate ratios plotted as a function of time from perihelion inside of 4.0 au. Symbols and colors are identical to Figure 2. The trends at larger distances (for instance, NH to OH and CN to OH) or lack thereof (C2 to OH and C3 to CN) are thought to be mostly due to inadequacies with the Haser model and the standard scalelengths when extrapolated to large distances. However, most noteworthy is the large trend seen in C2 to CN inbound but absent outbound; since model deficiencies cannot be the cause of this asymmetry, this must be indicative of a real seasonal effect due to differences in abundance ratios between source regions.
Other Images in This Article

Copyright and Terms & Conditions
© 2024. The Author(s). Published by the American Astronomical Society.