Image Details
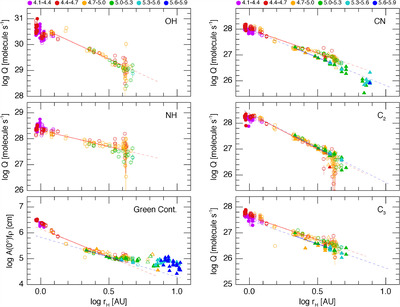
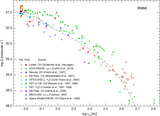
Caption: Figure 3.
Logarithm of the production rates for the observed molecular species and A(0°)fρ for the dust as a function of the logarithm of the heliocentric distance. Symbols and colors are identical to Figure 2. However, unlike in Figure 2, where all data are presented, observations at large heliocentric distances that are not considered useful due to large scatter are no longer shown (see text for details). Linear fits in log–log space were computed and shown as solid lines based on data between 1.2 and 4.0 au, with preperihelion given in red and postperihelion in blue. These fits are extrapolated to the full range of observations using dotted lines. Due to the gap in observations outbound, the postperihelion fits actually begin at 2.16 au, partially explaining the difference between the pre- and postperihelion slopes, most evident for the dust.
Other Images in This Article

Copyright and Terms & Conditions
© 2024. The Author(s). Published by the American Astronomical Society.