Image Details
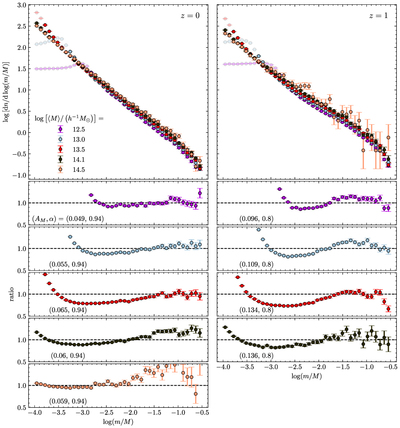
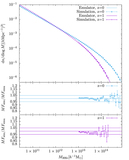
Caption: Figure 7.
Results from the application of the SMACC approach to the Farpoint simulation. Upper panels: average core mass functions at z = 0 (left) and z = 1 (right) for five host halo mass bins. (Details of the host mass bins are listed in Table 2.) Points for which ﹩\mathrm{log}(m/M)\leqslant \mathrm{log}(100{m}_{p,\mathrm{FP}}/\langle M\rangle )﹩ have enhanced color transparency, where mp,FP is the particle mass of the Farpoint simulation and 〈M〉 is the average host halo mass of each host halo bin. Following Sultan et al. (2021), for each host halo mass bin we fit Equation (9) to the opaque data points with α fixed to 0.94 and 0.8 for z = 0 and z = 1, and allow AM to vary. Lower panels: ratio of the opaque points of the core mass function (shown in the upper panel) to the fitting function, for each host halo mass bin and redshift. The best-fit parameter value for AM is indicated in each panel.
Other Images in This Article
Copyright and Terms & Conditions
© 2022. The Author(s). Published by the American Astronomical Society.