Image Details
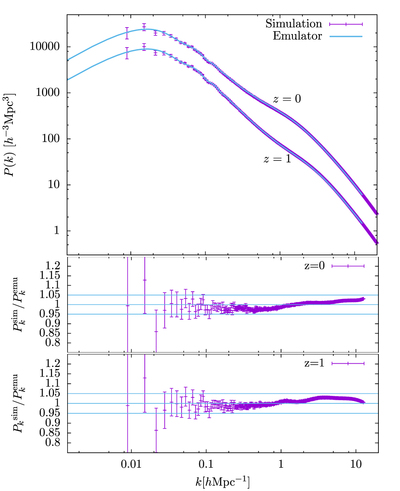
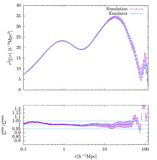
Caption: Figure 2.
Upper panel: power spectrum measurements at redshift z = 0 and z = 1. Predictions from the Cosmic Emulator by Heitmann et al. (2014) are shown for comparison. Lower panels: ratio of the simulation and the emulator at both redshifts out to k = 10h Mpc−1, the maximum range for which the emulator was developed. The light blue bands indicate a 5% range. The results are within the accuracy bounds reported in Heitmann et al. (2014).
Other Images in This Article
Copyright and Terms & Conditions
© 2022. The Author(s). Published by the American Astronomical Society.
Copyright ©
2025 Astronomy Image Explorer. All Rights Reserved.