Image Details
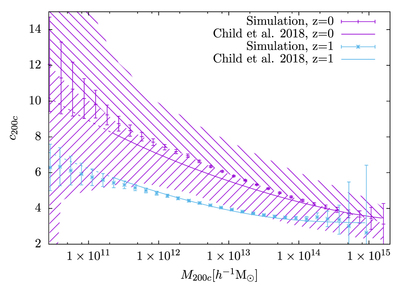
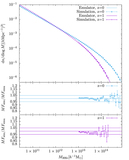
Caption: Figure 5.
Measurement of the halo concentration–mass relation at redshifts z = 0 (purple) and z = 1 (light blue). The shaded region shows the 1σ standard deviation for z = 0. For comparison, we show the fitting function derived in Child et al. (2018) as implemented in the COLOSSUS package (Diemer 2018). For the very low-mass regime, the fit is represented by a dashed line, indicating that the results from Child et al. (2018) were extrapolated in this mass range.
Other Images in This Article
Copyright and Terms & Conditions
© 2022. The Author(s). Published by the American Astronomical Society.
Copyright ©
2025 Astronomy Image Explorer. All Rights Reserved.