Image Details
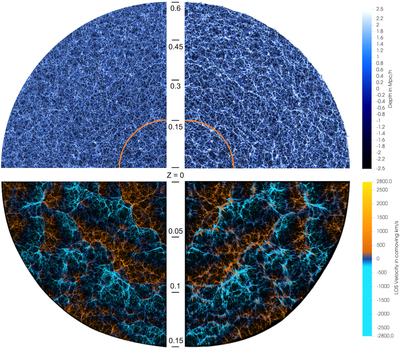
Caption: Figure 3.
Visualization of the particle light cone data out to z = 0.6 (upper panels) and a zoom-in to z = 0.15 (lower panels). The orange curve in the upper panels shows the z = 0.15 boundary. The color in the upper panels represents depth in the disk of particles (in Mpc h−1). In the lower panels, color represents LOS velocities (in comoving km s−1). The left panels render the comoving particle positions while the right panels demonstrate the so-called Fingers of God effect from redshift space distortion.
Other Images in This Article
Copyright and Terms & Conditions
© 2022. The Author(s). Published by the American Astronomical Society.
Copyright ©
2025 Astronomy Image Explorer. All Rights Reserved.