Image Details
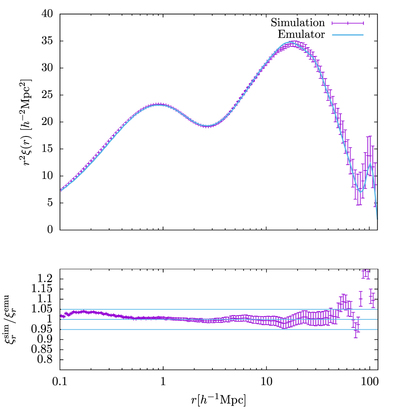
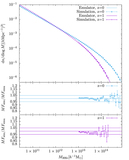
Caption: Figure 6.
The Farpoint particle correlation function at z = 0. The measurement from the simulation is shown in purple and predictions from the Mira–Titan emulator described in Lawrence et al. (2017) are shown in light blue. The BAO peak is visible at the right edge of the image. The ample resolution of the simulation allows us to evaluate the correlation function to scales down to 0.1h−1 Mpc.
Other Images in This Article
Copyright and Terms & Conditions
© 2022. The Author(s). Published by the American Astronomical Society.
Copyright ©
2025 Astronomy Image Explorer. All Rights Reserved.