Image Details
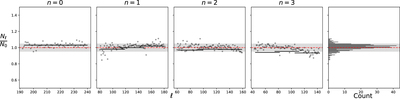
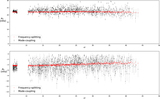
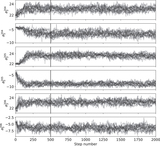
Caption: Figure 8.
The red line corresponds to N0. The gray region corresponds to 5% error from N0. The gray points correspond to Nℓ, and the solid black lines are from each MCMC simulation. The rightmost panel shows the histogram of all of the gray points, taken from all radial orders.
Other Images in This Article

Copyright and Terms & Conditions
© 2021. The American Astronomical Society. All rights reserved.
Copyright ©
2025 Astronomy Image Explorer. All Rights Reserved.