Image Details
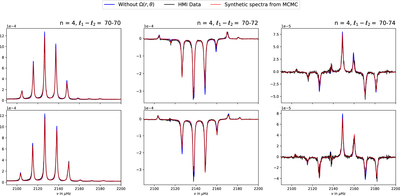
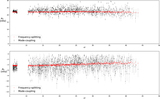
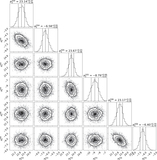
Caption: Figure 5.
Cross-spectrum for ℓ = 70 and Δℓ = 0, 2, 4. The upper panels correspond to m+, and the lower panels correspond to m−. The black curve shows observed data. The blue curve is the model before considering eigenfunction coupling, and the red curve corresponds to the model constructed using parameters estimated from MCMC.
Other Images in This Article

Copyright and Terms & Conditions
© 2021. The American Astronomical Society. All rights reserved.
Copyright ©
2025 Astronomy Image Explorer. All Rights Reserved.