Image Details
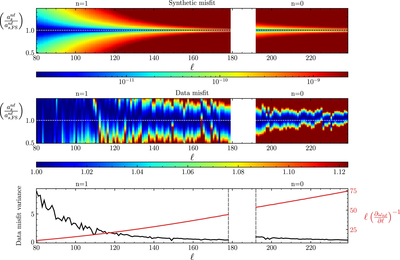
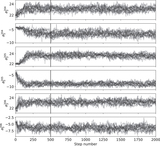
Caption: Figure 7.
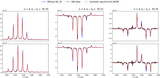
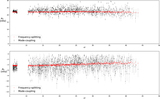
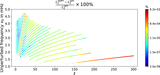
Sensitivity of spectral fitting to a-coefficients as a function of angular degree ℓ. The top panel shows the variation of misfit between synthetic data calculated using frequency-splitting a-coefficients ﹩{a}_{s,\mathrm{FS}}^{n{\ell }}﹩ and synthetic spectra computed from a scaled set of a-coefficients ﹩{a}_{s}^{n{\ell }}﹩. A well-defined minimum along ﹩{a}_{s}^{n{\ell }}/{a}_{s,\mathrm{FS}}^{n{\ell }}=1.0﹩, which broadens toward smaller ℓ, shows a drop in sensitivity of the spectra to variations in a-coefficients, as predicted by theory. The middle panel shows the sensitivity of a-coefficients, but now computed using the misfit between HMI and synthetic spectra computed from a scaled set of a-coefficients ﹩{a}_{s}^{n{\ell }}﹩. While it has the same qualitative drop in a-coefficient sensitivity for decreasing ℓ, the ridge of the minimum (darkest patch) is seen to deviate from ﹩{a}_{s,\mathrm{FS}}^{n{\ell }}﹩. The bottom panel shows in black the effective variance of misfit for each ℓ. The narrowing confinement of the data misfit toward higher ℓ is seen as a decreasing effective variance with increasing ℓ. The red line shows the increase in the factor ℓ/(∂ωnℓ/∂ℓ) that enhances sensitivity at higher ℓ, as predicted by Equation (18). The areas corresponding to radial orders n = 0, 1 are indicated on top of each plot.
Other Images in This Article

Copyright and Terms & Conditions
© 2021. The American Astronomical Society. All rights reserved.