Image Details
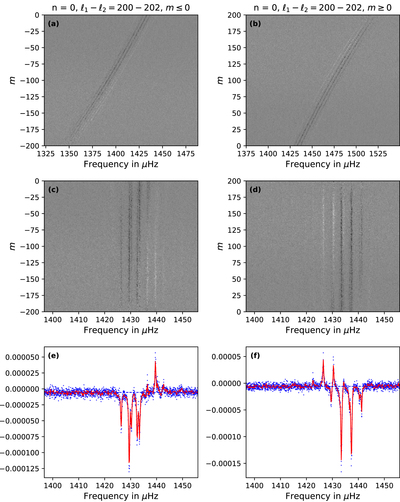
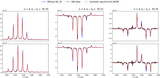
Caption: Figure 2.
Cross-spectral signal for ℓ = 200, Δℓ = 2, and n = 0. (a), (b) Observed cross-spectrum corresponding to m+ and m−. (c), (d) Derotated cross-spectrum corresponding to m+ and m−. (e), (f) ﹩{D}_{n}^{{\ell },{\rm{\Delta }}{\ell },\pm }﹩. The baseline is indicated by the dashed blue line. The blue dots represent observations from the five 72-day time series, and the red curve corresponds to the expectation value of the cross-spectrum.
Other Images in This Article
Copyright and Terms & Conditions
© 2021. The American Astronomical Society. All rights reserved.
Copyright ©
2025 Astronomy Image Explorer. All Rights Reserved.