Image Details
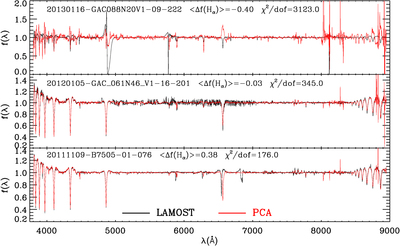
Caption: Figure 15.
A few typical examples that exhibit abnormal residuals between the LAMOST spectrum and the PCA reconstruction. The top panel shows a spectrum with problematic fluxes over the wavelength range of λ4700–5000 Å, leading to poor PCA reconstruction. The middle panel shows a spectrum with artifacts in the LAMOST spectra across λ5000–7000 Å. The PCA reconstruction is visually reasonable, but the χ2 between the LAMOST and PCA-reconstructed spectra is suboptimal. The bottom panel shows a spectrum that has a problematic wavelength calibration from the LAMOST pipeline in the wavelength range of λ5800–7000 Å.
Other Images in This Article
Show More
Copyright and Terms & Conditions
© 2021. The Author(s). Published by the American Astronomical Society.