Image Details
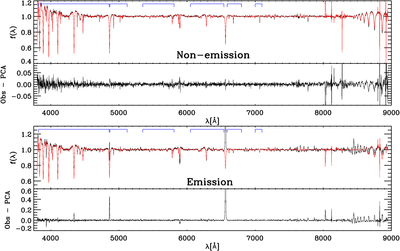
Caption: Figure 2.
Two example spectra reconstructed with a PCA method for a non-emission (top) and an emission (bottom) star. In each panel, black is the LAMOST spectrum, while red is the PCA-reconstructed spectrum. Marked in blue are the clean wavelength windows with which we construct the principal component coefficients for the PCA reconstruction. Note that, throughout this work, we normalize the spectra with a pseudo-continuum derived by smoothing the spectra with a Gaussian kernel 50 Å in width, as such some pixels in the continuum-normalized spectra can exceed unity.
Other Images in This Article
Show More
Copyright and Terms & Conditions
© 2021. The Author(s). Published by the American Astronomical Society.
Copyright ©
2026 Astronomy Image Explorer. All Rights Reserved.