Image Details
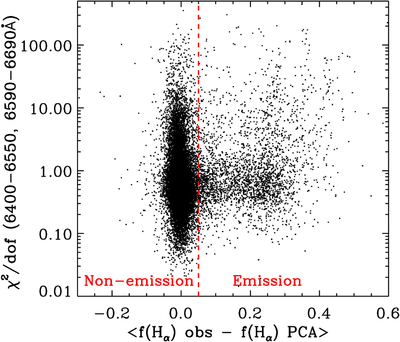
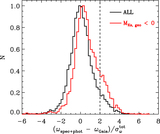
Caption: Figure 3.
Observed ﹩{{\rm{H}}}_{\alpha }﹩ flux excess for emission spectra with respect to the PCA reconstruction. The horizontal axis shows the differences in mean ﹩{{\rm{H}}}_{\alpha }﹩ fluxes in λ6571–6557 Å between the observed LAMOST spectra and the reconstructed PCA spectra. The vertical axis shows the reduced χ2 across the wavelength range that encapsulates the ﹩{{\rm{H}}}_{\alpha }﹩ features (λ6400–6550 Å, λ6590–6690 Å). Spectra with emission lines exhibit a large difference in the ﹩{{\rm{H}}}_{\alpha }﹩ line between the LAMOST and PCA-reconstructed spectra and are clearly separated from the majority of stars. The vertical dashed line delineates our criterion to select OB spectra with emission lines.
Other Images in This Article
Show More
Copyright and Terms & Conditions
© 2021. The Author(s). Published by the American Astronomical Society.