Image Details
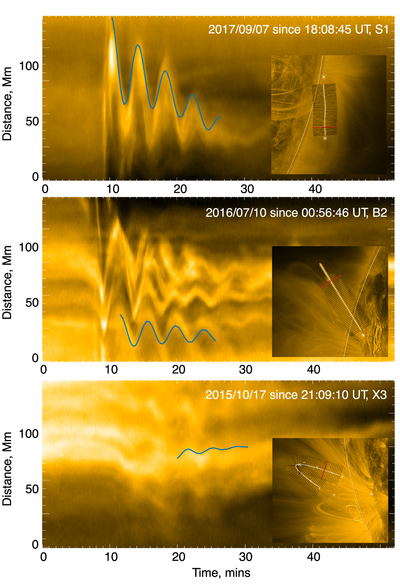
Caption: Figure 1.
Examples of the TD maps of kink oscillations of three different types: S1, B2, and X3 (from top to bottom, respectively), as described in Section 2. The blue curves show best-fitting exponentially decaying harmonic signals with power-law trends. The inset shows the active region with loops, and the red line corresponds to the slit shown.
Other Images in This Article
Copyright and Terms & Conditions
© 2019. The American Astronomical Society. All rights reserved.
Copyright ©
2026 Astronomy Image Explorer. All Rights Reserved.