Image Details
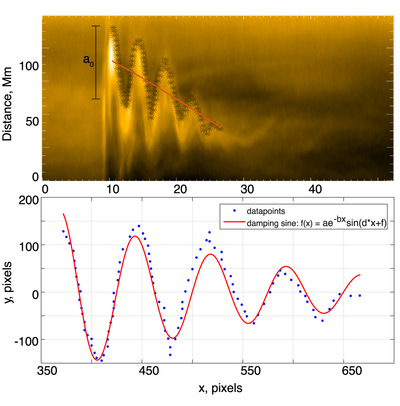
Caption: Figure 3.
Example of the determination of the oscillation parameters. (Top panel): the semi-transparent black stars show the instantaneous positions of the boundary of the oscillating loop, picked by hand for tracking the oscillation. The power-law background trend is shown by the red line. The initial displacement a0 is also shown. (Bottom panel): the blue dots show the detrended signal. The red curve shows the best-fitting exponentially decaying harmonic oscillation.
Other Images in This Article
Copyright and Terms & Conditions
© 2019. The American Astronomical Society. All rights reserved.
Copyright ©
2024 Astronomy Image Explorer. All Rights Reserved.