Image Details
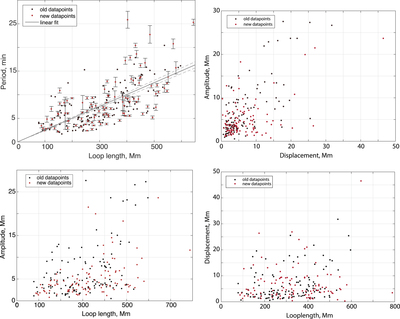
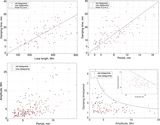
Caption: Figure 5.
Mutual scalings of parameters of 223 kink oscillations. (Top left): periods against the oscillating loop lengths. The linear fit of the data passing through the origin is shown by the solid gray line with a gradient of 0.025 ± 0.001. The gradient error is shown by the gray dashed lines. (Top right): apparent oscillation amplitudes against the initial loop displacement. (Bottom left): apparent oscillation amplitudes against the loop lengths. (Bottom right): initial displacement against the loop length.
Other Images in This Article
Copyright and Terms & Conditions
© 2019. The American Astronomical Society. All rights reserved.
Copyright ©
2024 Astronomy Image Explorer. All Rights Reserved.