Image Details
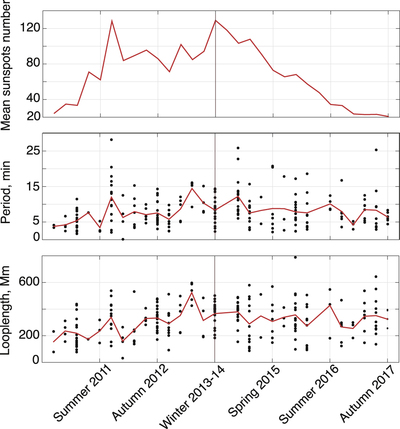
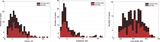
Caption: Figure 7.
(Top panel): the average sunspot number. Thick vertical line separates the rising and declining phases of the solar cycle. (Center panel): time evolution of the detected oscillation periods and (Bottom panel): the oscillating loop lengths (central) from 2010 August to 2017 October. The black data points correspond to the measured periods of the oscillations. The red curve corresponds to the evolution of the mean value. The time step is 3 months.
Other Images in This Article
Copyright and Terms & Conditions
© 2019. The American Astronomical Society. All rights reserved.
Copyright ©
2024 Astronomy Image Explorer. All Rights Reserved.